This article is specific to the updated TrackVia UI released in Fall 2026
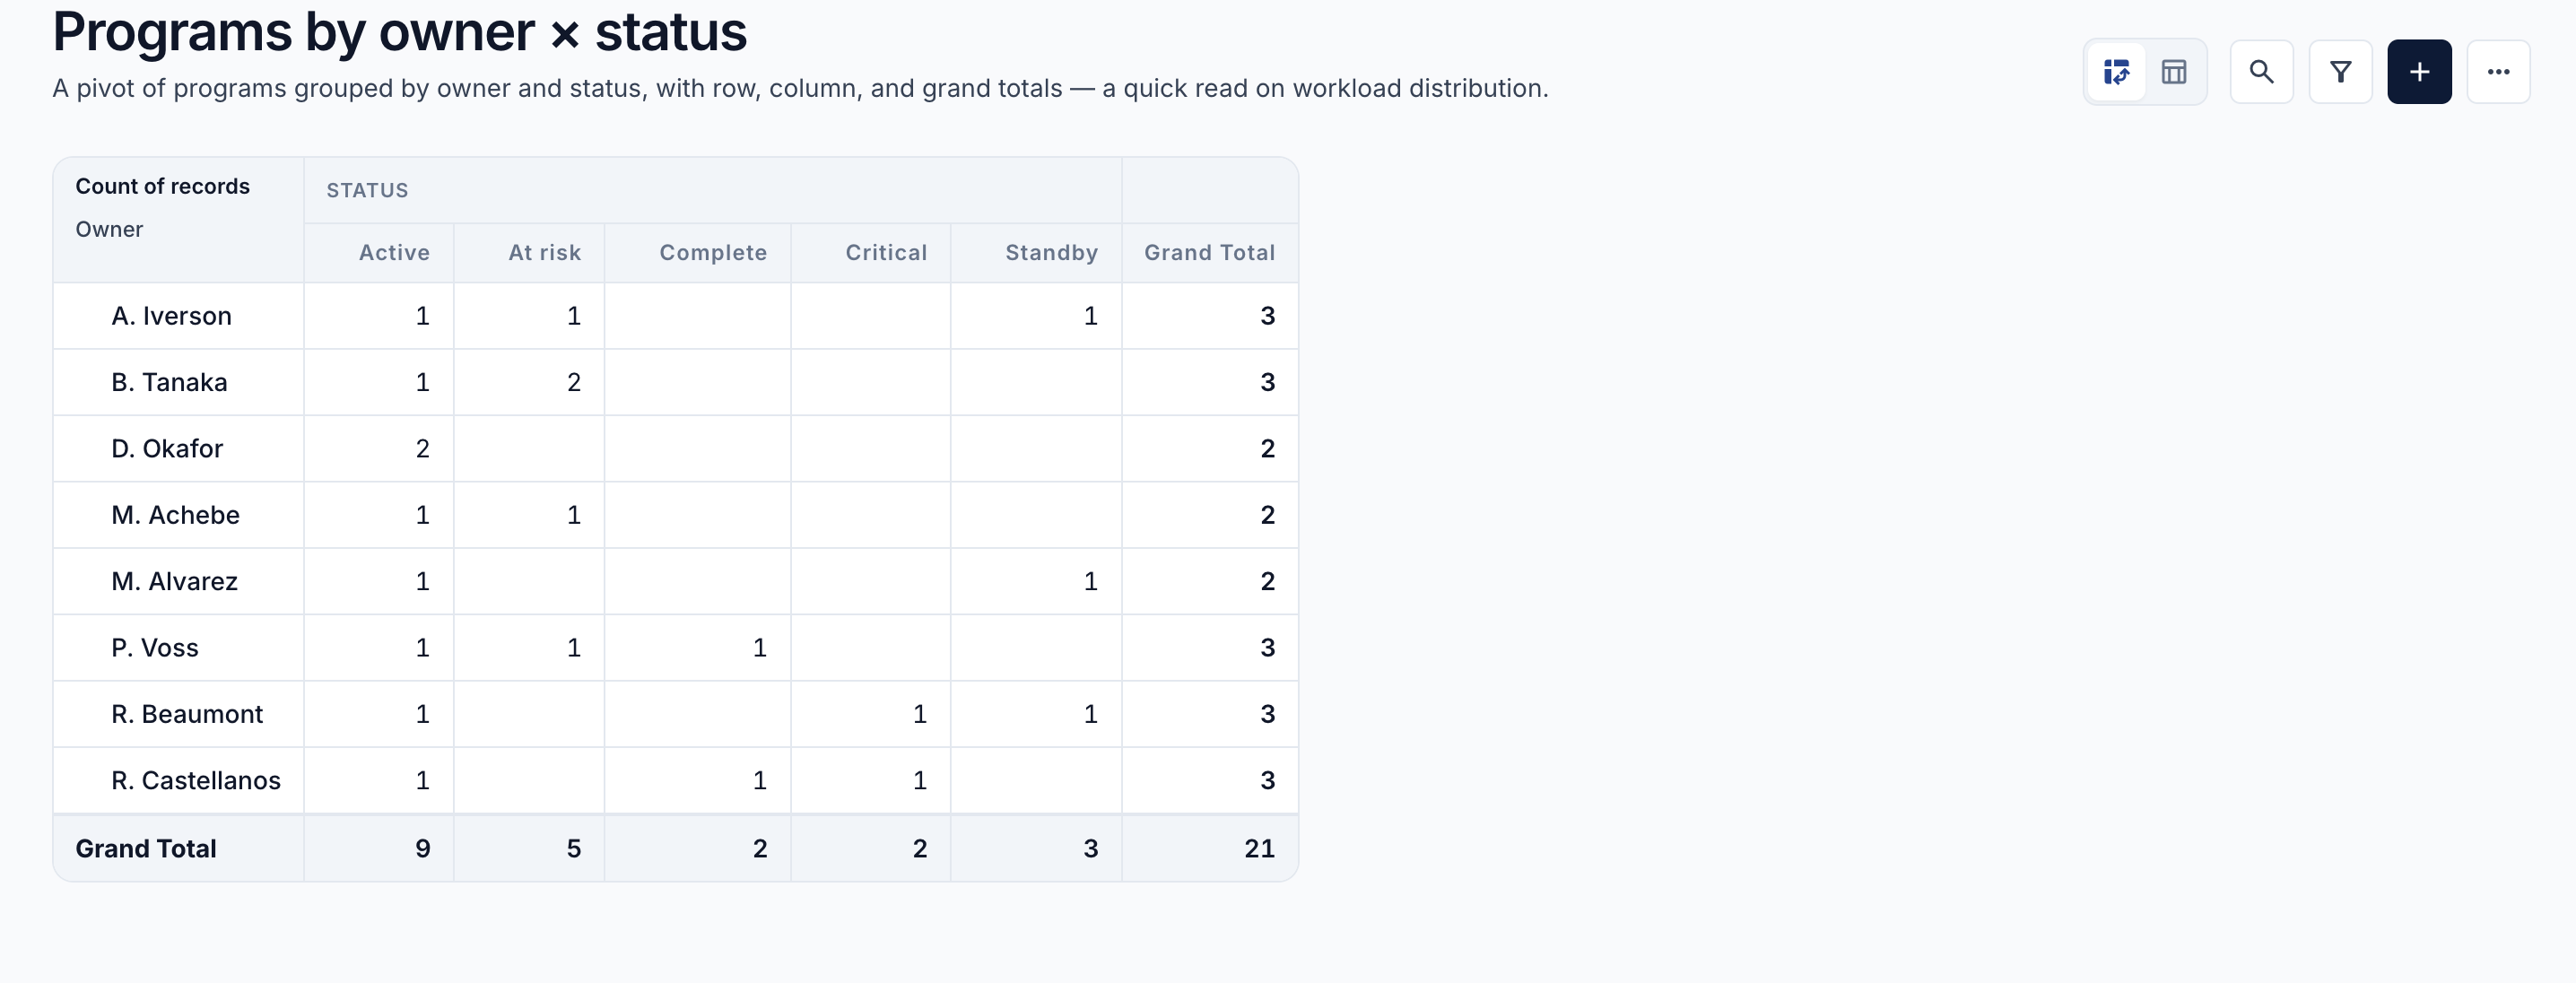
A Pivot view summarizes many records into a compact cross-tab table. You choose a field to group the rows, a field to group the columns, and a value to aggregate in each cell (a count, sum, or average) so the view answers a question about totals rather than listing the underlying records one by one.
When to Use a Pivot View
- When you need totals broken down by two dimensions at once, such as records by status and by owner
- When the underlying table has far too many records to read individually, and only the summarized numbers matter
- When you want to spot concentrations or gaps in a data set, such as one region or one category carrying most of the volume
- When the same summary needs to be checked regularly, since the Pivot view recalculates as records change
- When the numbers themselves are the deliverable and will be read, exported, or reported on
When to Avoid Using a Pivot View
- If you need to see, open, or edit individual records, a Grid view is more suitable
- If you are summarizing by only one dimension, a chart is usually easier to read
- If either grouping field has a very large number of distinct values, since the table becomes too wide or too long to scan
- If the takeaway is a comparison or a trend meant to be read at a glance, a Column or Line Chart communicates it faster
- If the field you want to aggregate is not numeric and a simple count will not answer your question
Example Use Cases for Pivot Views
- Counting open work orders by status across each location
- Summing project costs by department and by quarter
- Showing the number of inspections completed by inspector and by month
Pivot views: wrap long headers
By default, a long column header in a pivot view is shortened to fit, so you only see the start of the label. To see the full text in a pivot view:
- In the pivot view toolbar, click the ellipsis (...).
- Switch on Wrap column headers.
With Wrap column headers on, long column headers and long row labels in the pivot view wrap onto more than one line. Headers that already fit don't change.
Wrap column headers is off by default. The setting is saved for each pivot view in your current browser.
Pivot views: pinned row headings when you scroll
A pivot view can group rows by more than one field. Each group then starts with a heading row, such as Samsung with Galaxy S10 underneath it.
As you scroll down a long pivot view, the headings for the group you're in stay pinned to the top, just below the column headers. The pinned headings show which group the rows below belong to.
Nested groups stack with the outermost group first. Inside the Galaxy S10 group under Samsung, Samsung is pinned above Galaxy S10. When you scroll into the next group, the pinned headings change to match the next group.
Pinned headings sit on top of the rows instead of pushing them down, so the pivot view doesn't jump while you scroll. Each pinned heading shows the group's values lined up under the columns.
When you scroll right, the pinned values move with the columns, and the row label column stays on the left. The Grand Total row stays pinned at the bottom.
Pinned headings are for reference only. Clicking a pinned heading doesn't expand or collapse the group. If you expand or collapse a group while scrolled down, the pinned headings update to match.
Pinned headings only appear when a pivot view groups rows by more than one field and is long enough to scroll. There's no setting to turn pinned headings on or off.
Comments
0 comments
Please sign in to leave a comment.